 |
The K2
Atlas
in the
10487-12000 cm-1
spectral range
|
|
I. Experimental conditions
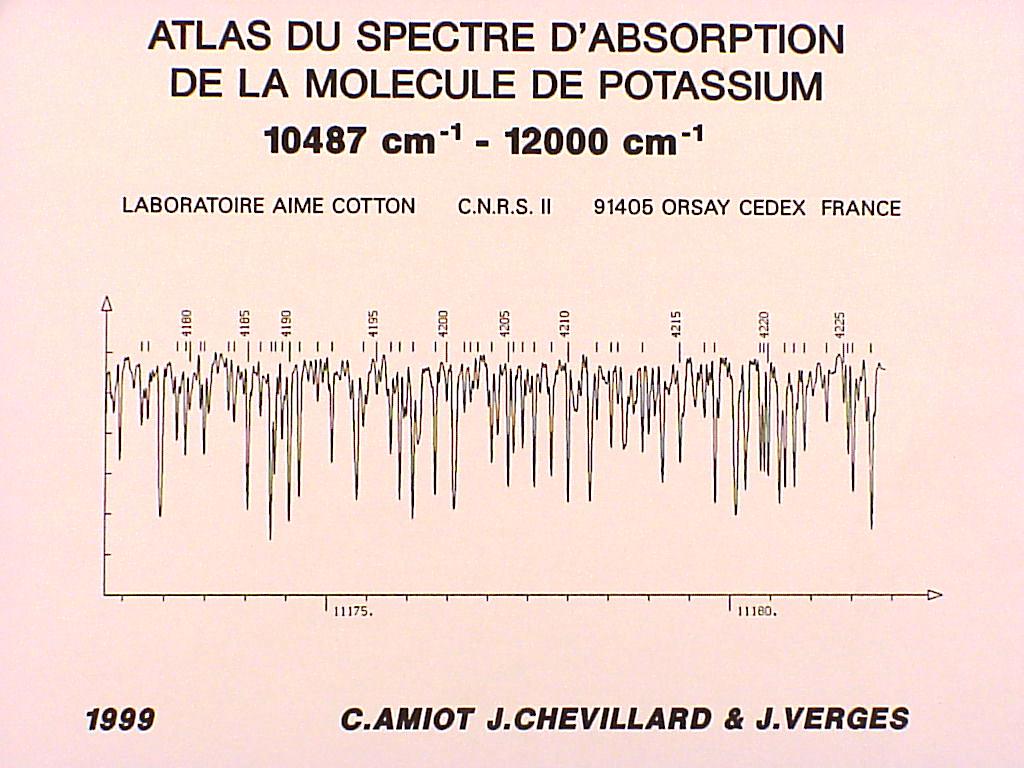
The absorption spectrum
of the K2 molecule in the 10487-12000 cm-1 spectral
range is presented in this Atlas. It is due to the transition between the
(A) 1Sigma+u
and (X)1Sigma+g
electronic states. This spectral region is included in two previously published
atlases [1,2].
The present work was
performed for two reasons:
- the experimental
conditions proposed to the potential users are easiest to implement than
in the two previously cited references ;
- the hyperfine structure
affecting the lines are of much fainter intensity than those in the I2
case, leading to a better wavenumber determination.
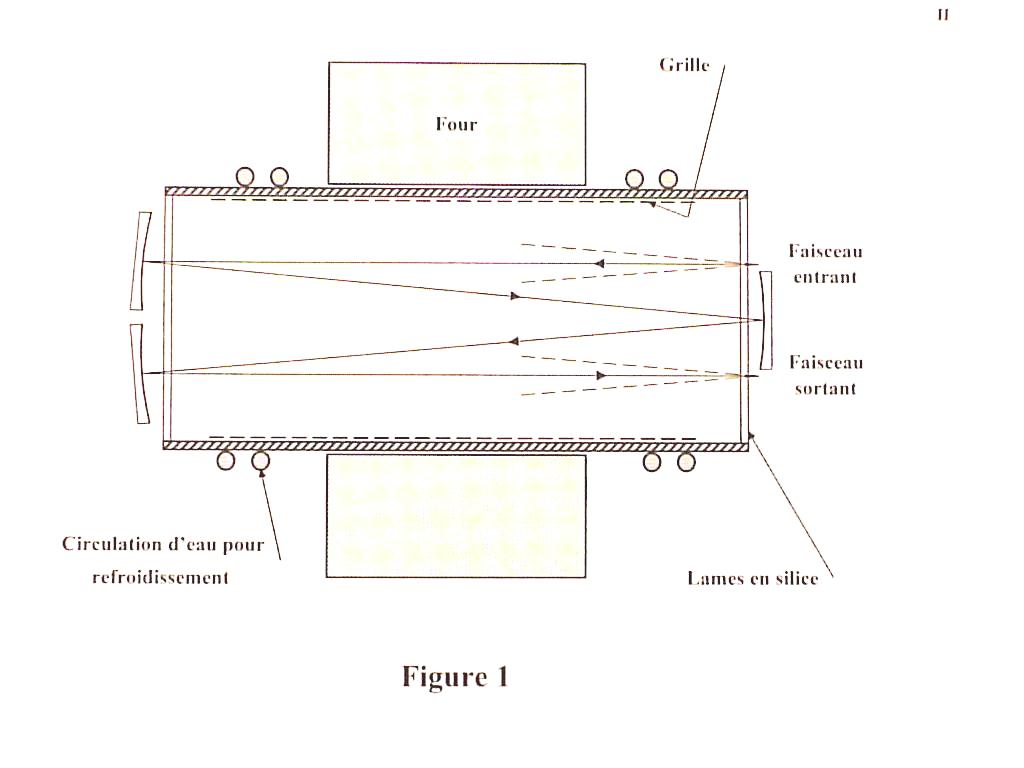
The used absorption
cell is represented in Fig. 1. It is a stainless steel pipe, 480 mm long
and with 63 mm external diameter. The active part is approximately the
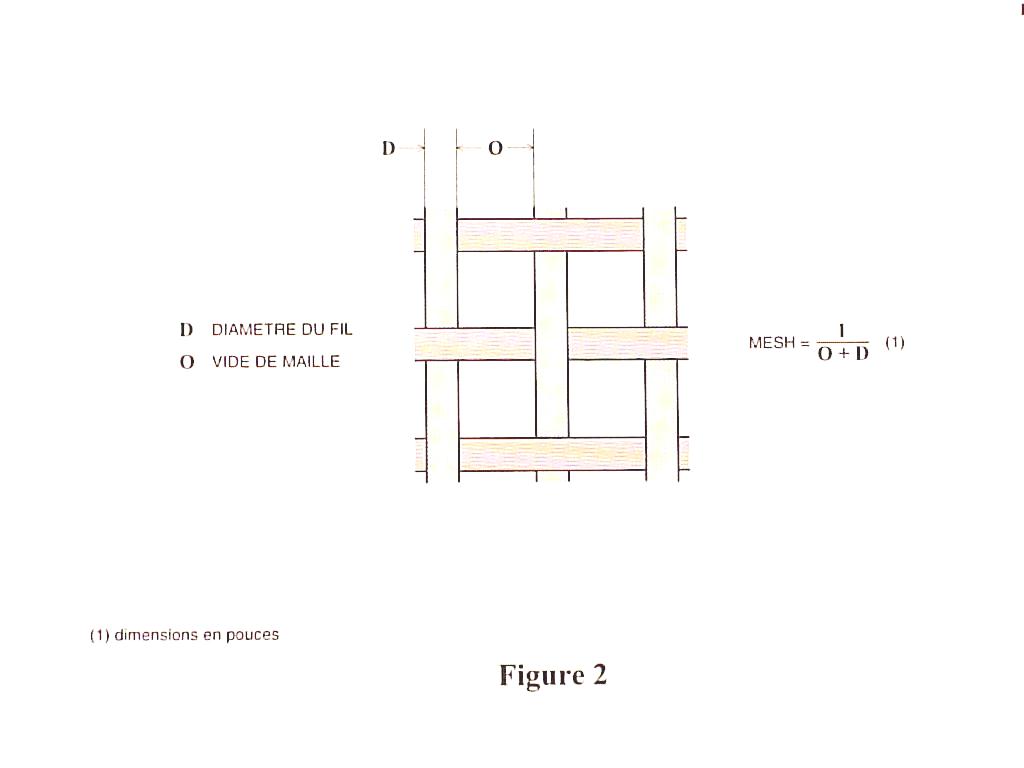
length of the heating oven i.e. 250 mm. The grid (250 mesh), made of stainless
steel (type 304), is realized with a 40 mm
diameter (D) thread, the distance O between two consecutive threads being
61 mm (Fig. 2). The grid is composed
of three layers of this wire gauze and extends after the cooling zone.
The metal, evaporating in the central part, moves through the mesh due
to capillarity. The pressure of the metallic vapour is balanced by an inert
gas, argon, preventing from potassium condensation on the windows [3].
The heat pipe is inserted in a White type cell, ruled for four passes (Fig.
1), and giving a one meter absorption length [4].
The K2
absorption spectrum was recorded under the following source conditions
:
argon pressure 6 mbarr (610 P) ; temperature
550 K. The continuous background spectrum is provided by a 250 W halogen
type lamp (tungsten wire), the electrical power being limited to 90 W during
the experiment. The Fourier transform spectrometer used for the spectrum
recording is described in [5].
II. Presentation of Plates and Tables
Each page of the atlas, noted Page_001,
002,...reproduce equally spaced ranges of the spectrum. A small overlapping
spectral range exists between successive plates. The vertical scale, indicating
the absorption of each line profile, is given in arbitrary units but the
continuous background is normalized to unity for each plate. The estimated
local noise [6] is visualized at right of the vertical axis by a line portion
limited by two opposed triangles. The wavenumber scale is equal to 0.5
cm-1/cm when the distance between abcissae ticks is 2 cm. Each
reference line is marked by a vertical tick, located in the upper part
of the spectrum. These ticks are numbered each 5 value, the corresponding
ticks being longer. A spectral line is retained as a reference one if the
two criteria are fullfiled :
all lines with a width (evaluated at half
maximum) larger than 1.8 times the instrumental resolution (0.02 cm-1)
are discarded ;
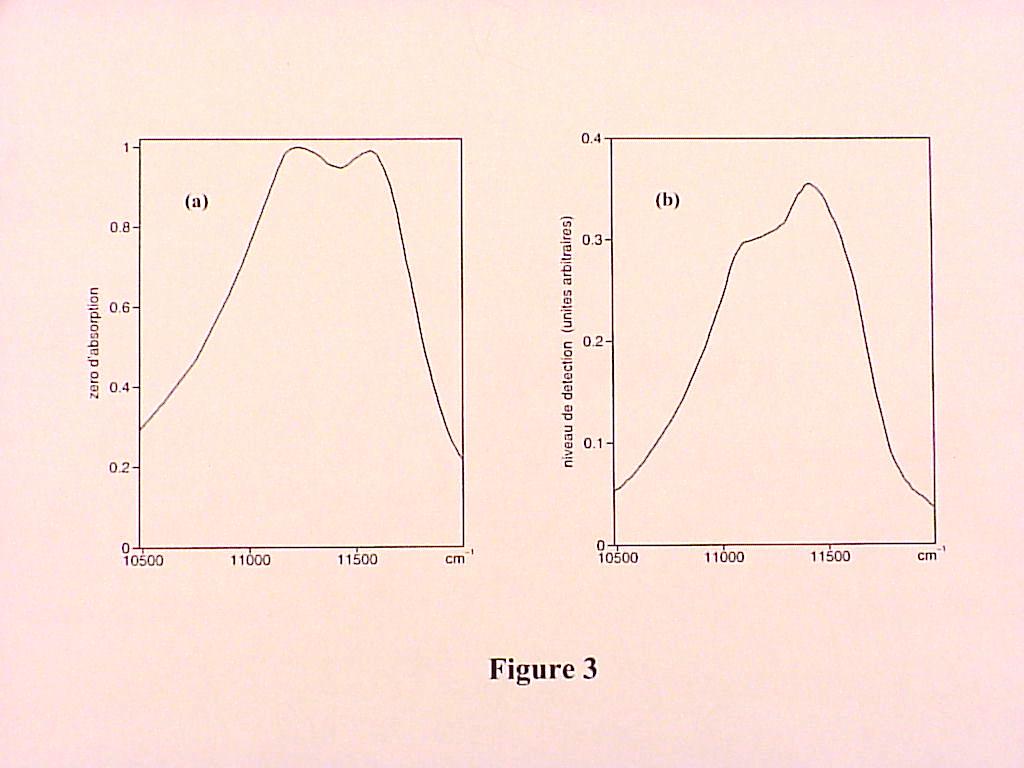
the detection level (relative absorption)
is choosed in order to ensure a nearly constant density of reference wavenumbers
in each studied spectral range (Fig. 3b).
The evolution of the background, not really
continuous due to various effects, is depicted in Fig. 3a.
The Tables of wavenumbers, noted Sigma
P001,... Sigma Pn, correspond to each plate Page001,...Page n. They
are organized as follows :
First column : numeration number near the
vertical ticks ;
Second column : vacuum wavenumber in cm-1
;
Third column : relative absorption intensity
(multiplied by 100) ;
Fourth column : width of the line at half
height in 10-3 cm-1.
Additional informations about the characterization
of the lines can be found in [6].
III. Calibration of the
wavenumbers and accuracy
A complementary experiment was performed
on the atomic resonance transition
6p 2P1/2---6s
2S1/2
of
cesium, appearing in the considered spectral region. An accurate frequency
measurement of this transition gave [7] n
= 335 116 48 807 (41) kHz or s = 11178.2681607
(14) cm-1. The Fourier measurement, 11178.2710 cm-1,
shows a difference lower than 0.003 cm-1. However the K2
absorption and Cs2 emission spectra were successively recorded.
As a consequence systematic errors due to the interferometer, to the electronic
path difference servo-control, to the source,... can perturb the measurements.
These different errors were analysed and evaluated [8]. The major uncertainty
is due to the wavenumber precision of the Xe radiation used to monitor
the path difference in the interferometer. All these errors lead to a 0.0013
cm-1 uncertainty.
In conclusion, for the stronger lines, the
uncertainty of the reported wavenumbers should not exceed 0.005 cm-1.
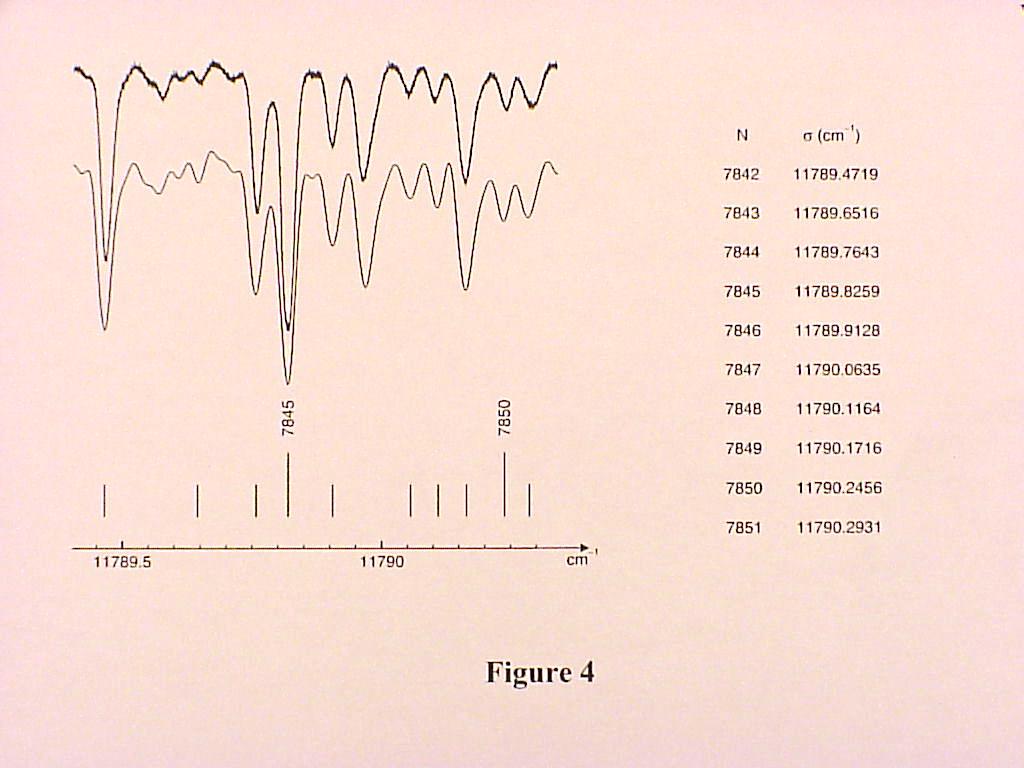
IV. Comparison between the atlas spectrum and a laser induced fluorescence
spectrum
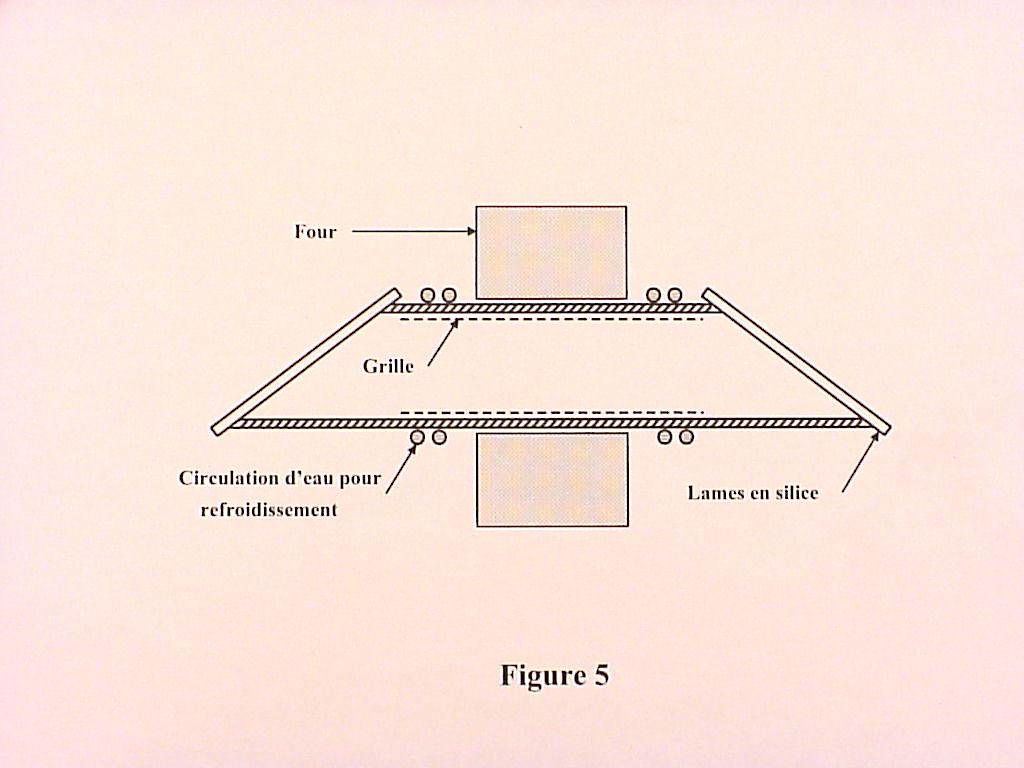
The lower trace in Fig. 4 depicts a portion
of the present atlas spectrum (upper part of Page 71). The upper
trace shows the same spectral range recorded after variable frequency laser
excitation and recording of the global emitted fluorescence light. The
used heat pipe (Fig. 5) is identical to the one represented in Fig. 1 with
different dimensions : length of 550 mm, external diameter equal to 33
mm, heated length of 150 mm. The exciting laser radiation (Ti:Sa 899-21
Coherent), attenuated by a factor of 1000 in order to avoid saturation
effects, delivers a power of some milliwatts. Under these conditions the
two spectra of Fig. 4 are very similar.
References
[1] S. Gersternkorn, J. Vergès,
J. Chevillard, Atlas du spectre d'absorption de la molécule d'iode
(11000-14000 cm-1). Laboratoire Aimé Cotton, C.N.R.S.
II, Bâtiment 505, Campus d'Orsay, 91405 Orsay Cedex, France.
[2] S. Gersternkorn, P. Luc, J. Vergès,
Atlas du Spectre d'absorption de la molécule d'iode (7220-11200
cm-1). Laboratoire Aimé Cotton, C.N.R.S. II, Bâtiment
505, Campus d'Orsay, 91405 Orsay Cedex, France.
[3] C.R. Vidal , J. Cooper, J. Appl. Phys.
40,
3370-3374 (1969).
[4] J.U.White, J. Opt. Soc. Am. 32,
285-288 (1942).
[5] J. Connes, H. Delouis, P. Connes, G.
Guelachvili, J.P. Maillard, G. Michel, Nouv. Rev. Opt. Appl. 1,
3-22 (1970).
[6] H. Delouis, Thèse d'Etat, Université
Paris XI Orsay (1973).
[7] Th. Udem, J. Reichert, R. Holwarth, T.W.
Hansch, Phys. Rev. Lett. 82, 3568-3571 (1999).
[8] G. Guelachvili, Thèse d'Etat,
Université Paris XI Orsay (1973).
