
in the
9700-11000 cm-1
spectral range

|
in the 9700-11000 cm-1 spectral range |
|
|
|
|
|
|
|
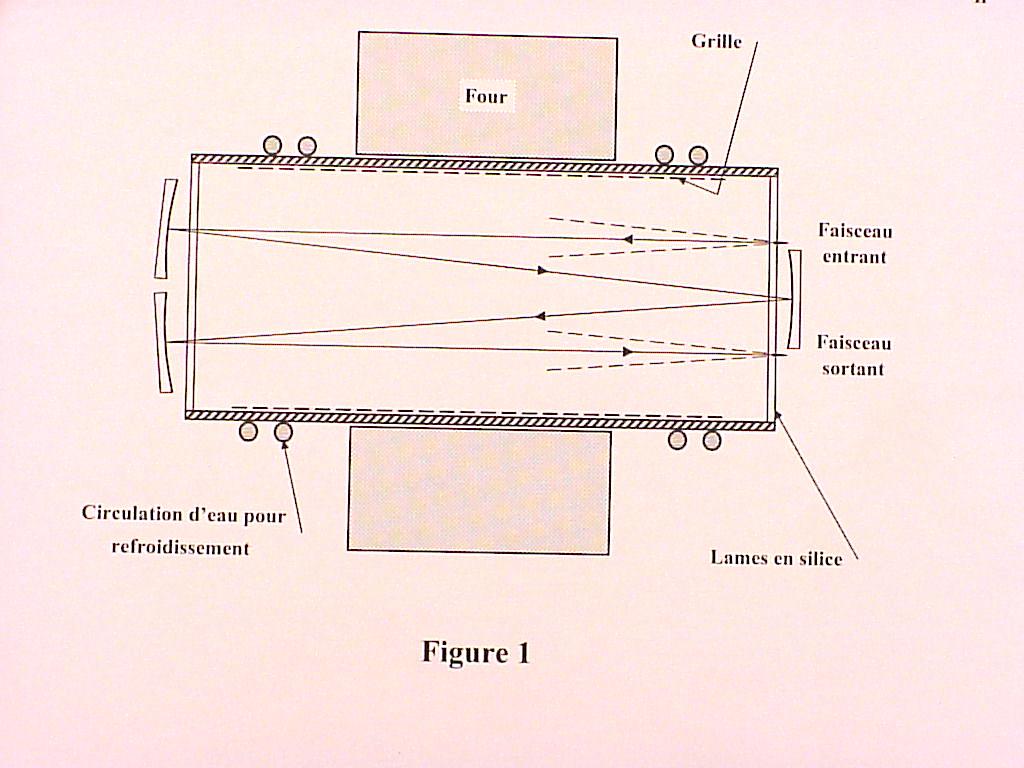
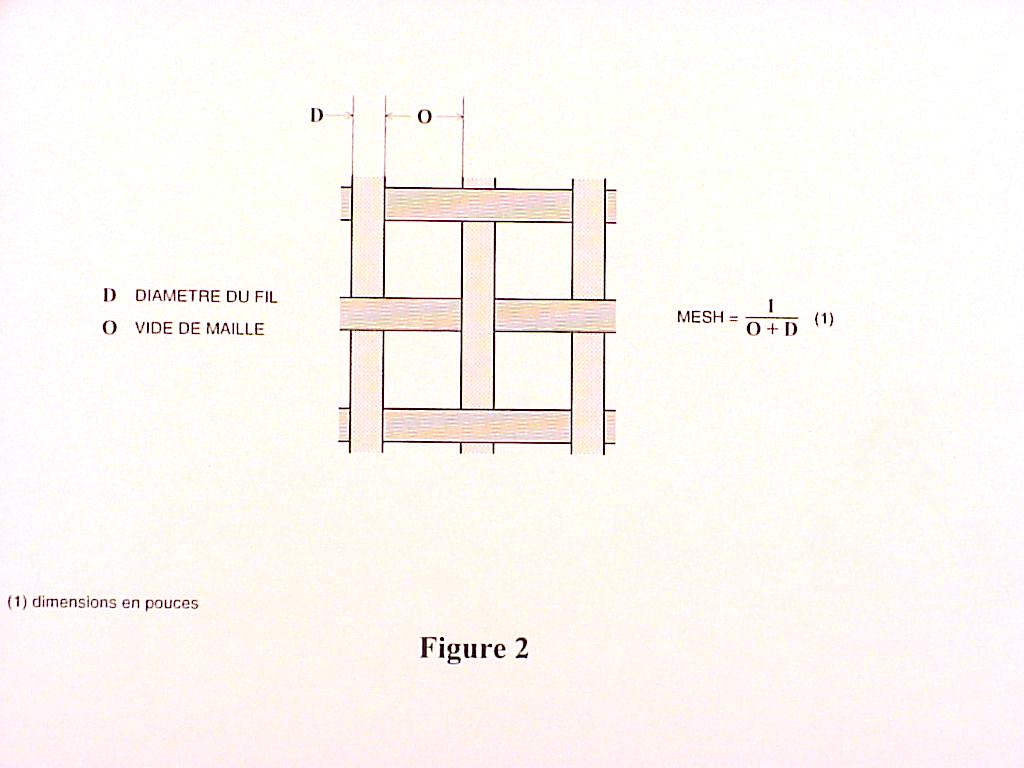
The used absorption cell is represented in Fig. 1. It is a stainless steel pipe, 480 mm long and with 63 mm external diameter. The active part is approximately the length of the heating oven i.e. 250 mm. The grid (250 mesh), made of stainless steel (type 304), is realized with a 40 mm diameter (D) thread, the distance O between two consecutive threads being 61 mm (Fig. 2). The grid is composed of three layers of this wire gauze and extends after the cooling zone. The metal, evaporating in the central part, moves through the mesh due to capillarity. The pressure of the metallic vapour is balanced by an inert gas, argon, preventing from potassium condensation on the windows [3]. The heat pipe is inserted in a White type cell, ruled for four passes (Fig. 1), and giving a one meter absorption length [4].
The Cs2 absorption spectrum was recorded under the following source conditions :
argon pressure 6 mbarr (610 P) ; temperature 550 K. The continuous background spectrum is provided by a 250 W halogen type lamp (tungsten wire), the electrical power being limited to 90 W during the experiment. The Fourier transform spectrometer used for the spectrum recording is described in [5].
Third column : relative absorption intensity (multiplied by 100) ;
Fourth column : width of the line at half height in 10-3 cm-1.
Additional informations about the characterization of the lines can be found in [6].
III. Calibration of the
wavenumbers and accuracy
A complementary experiment was performed on the atomic resonance transition
6p 2P1/2---6s 2S1/2 of cesium, appearing in the considered spectral region. An accurate frequency measurement of this transition gave [7] n = 335 116 48 807 (41) kHz or s = 11178.2681607 (14) cm-1. The Fourier measurement, 11178.2710 cm-1, shows a difference lower than 0.003 cm-1. However the absorption and emission spectra were successively recorded. As a consequence systematic errors due to the interferometer, to the electronic path difference servo-control, to the source,... can perturb the measurements. These different errors were analysed and evaluated [8]. The major uncertainty is due to the wavenumber precision of the Xe radiation used to monitor the path difference in the interferometer. All these errors lead to a 0.0013 cm-1 uncertainty.
In conclusion, for the stronger lines, the
uncertainty of the reported wavenumbers should not exceed 0.005 cm-1.
[5] J. Connes, H. Delouis, P. Connes, G. Guelachvili, J.P. Maillard, G. Michel, Nouv. Rev. Opt. Appl. 1, 3-22 (1970).
[6] H. Delouis, Thèse d'Etat, Université Paris XI Orsay (1973).
[7] Th. Udem, J. Reichert, R. Holwarth, T.W. Hansch, Phys. Rev. Lett. 82, 3568-3571 (1999).
[8] G. Guelachvili, Thèse d'Etat, Université Paris XI Orsay (1973).
|
|
|
|
|
|